Structural asset portfolio
Analysis of asset data provides insights and understanding of an infrastructure portfolio. Modern statistical analysis has been used on a number of Centra projects. This involves a thorough analysis of asset performance, lifespan, and maintenance requirements, as well as an evaluation of structural factors that may impact asset performance.
Methodology
Transport for NSW manages a large number of structures.
- Bridge Information System (BIS) maintains asset information, including technical data, location, and heritage registrations.
- BIS is used to track maintenance and rehabilitation history, as well as calculate the Bridge Health Index (BHI).
- A statistical analysis of the BIS data was undertaken.
Key Findings from BIS Data
Notable features of the asset management portfolio include:
- Relationship between structural age and condition
- Operational trends can be seen in the historical data
- Trends are clear in maintenance expenditures and Routine Maintenance Actions
Operation, Mainteance and Rehabilitation Program Considerations
The program is based on work types, including:
- Assessment of current asset condition
- Heritage listing status + Level of Service Assessment
- Forward program built on BIS and site inspections
Asset maintenance accompishment history
A mosaic chart used to visualize categorical data. This specific plot shows the distribution of four maintenance accomplishment categories: Reactive, Pavement, Roadside, and Traffic across four years (Years 1 to 4). The area of each rectangular block is proportional to the number of observations within that category and year.
General Observations about Mosaic Plots
- Mosaic plots are useful for visualizing complex relationships between categorical variables.
- They help identify patterns or trends that may not be immediately apparent from raw data.
- By comparing proportions of each category across different levels of a variable, mosaic plots enable informed inferences about the relationship between variables.
Future Directions
- Further analysis is warranted to confirm whether these observations hold true for other datasets or locations.
- Investigating the specific characteristics of historical trends and their impact on accomplishment distribution could provide additional insights.
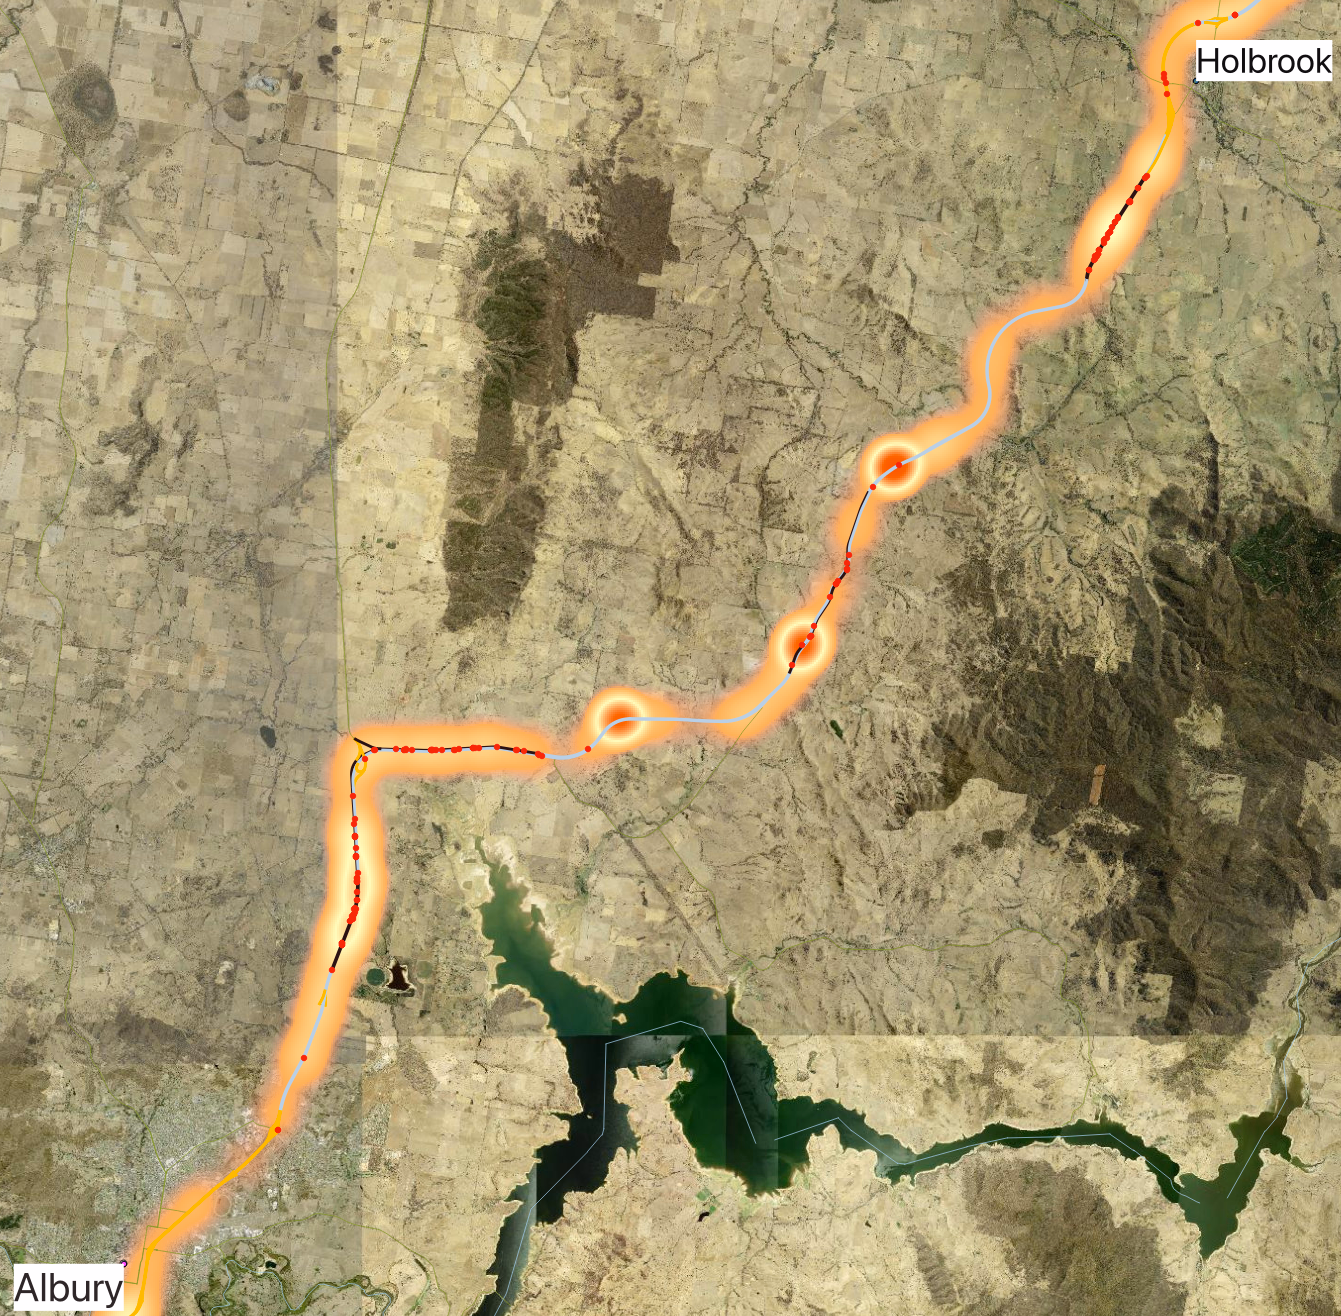
Maintenance accomplishment heatmap & defect locations for Southern Hume Highway